Investors Should Do Less of This…
Here’s a chart that caught my attention. It helps create a picture of underlying value.
And that always relates back to demographic shifts, handing over the generational baton from the Baby Boomers to the Millennials of Generation Y, population events and the dynamic surprises that await us on the road ahead.
So what factors drive good companies and/or bad investments?
Check the chart below and see if you can find the extreme themes (hint: the secret is in the second identical chart with red highlights added):
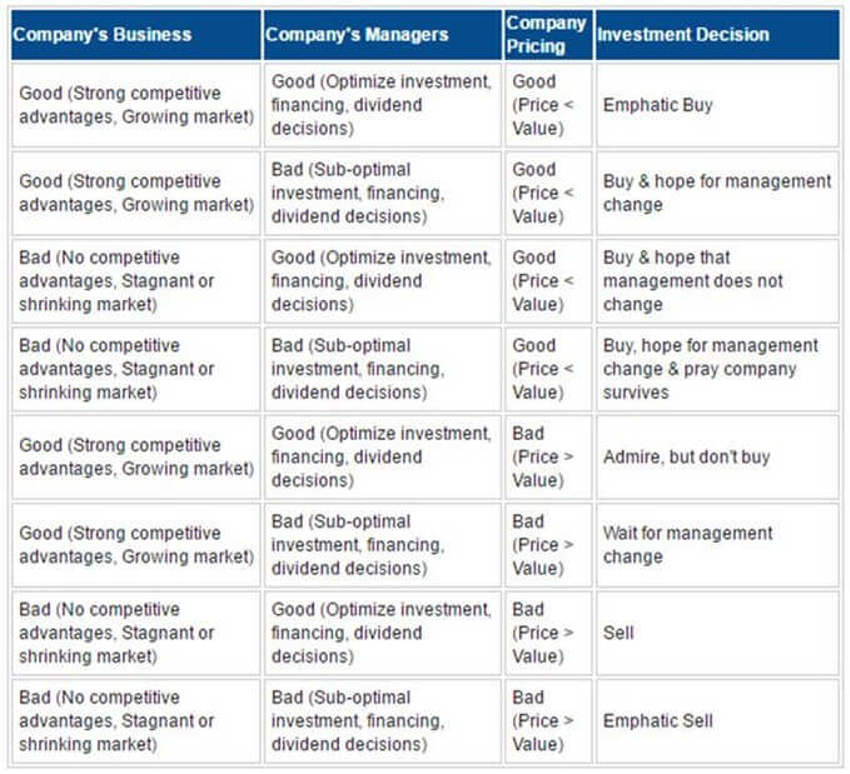
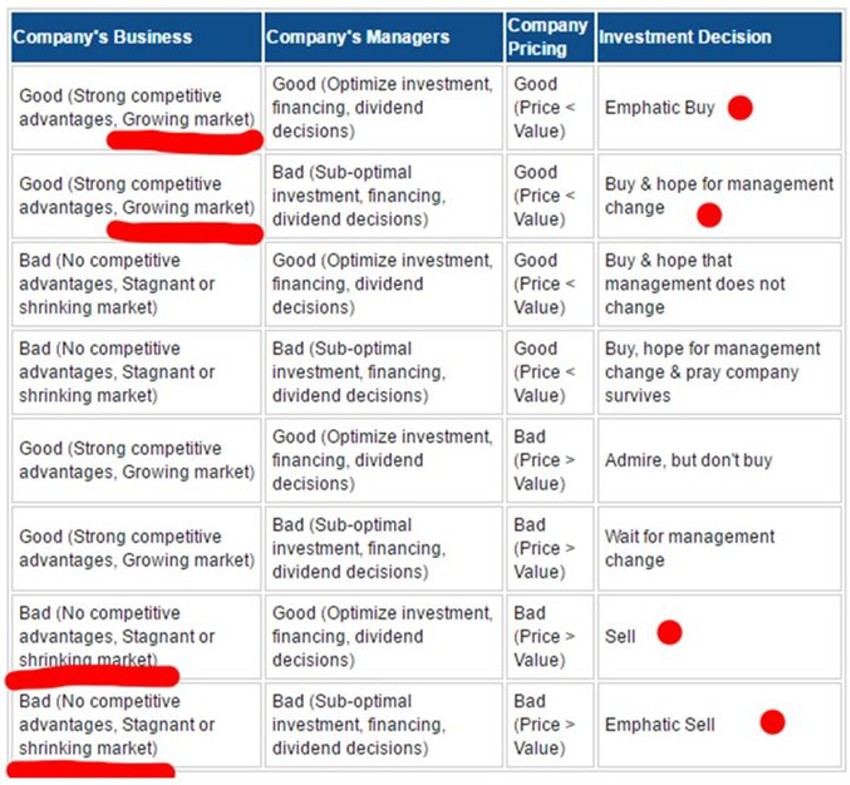
Of course, the highlight is a growing or shrinking market that helps to define good and bad investments at their core.
And sure, there are other ancillary items that are layered on top over time, but at the foundation level there is a growing or shrinking crowd of customers demanding a widget.
What defines that demand are people, population shifts, generations, habit and natural progression - demography.
And that's why we consistently say that investors should think demographics, not economics.
Data Driven
I like to look at a lot of data (obviously), and over time it has helped keep me sane and from acting emotionally.
Oddly enough, I look at things that many might overlook and try to find the value in that information too.
This chart from Doug Short caught my eye for reasons many may not immediately see so, I’ll highlight that below and explain:
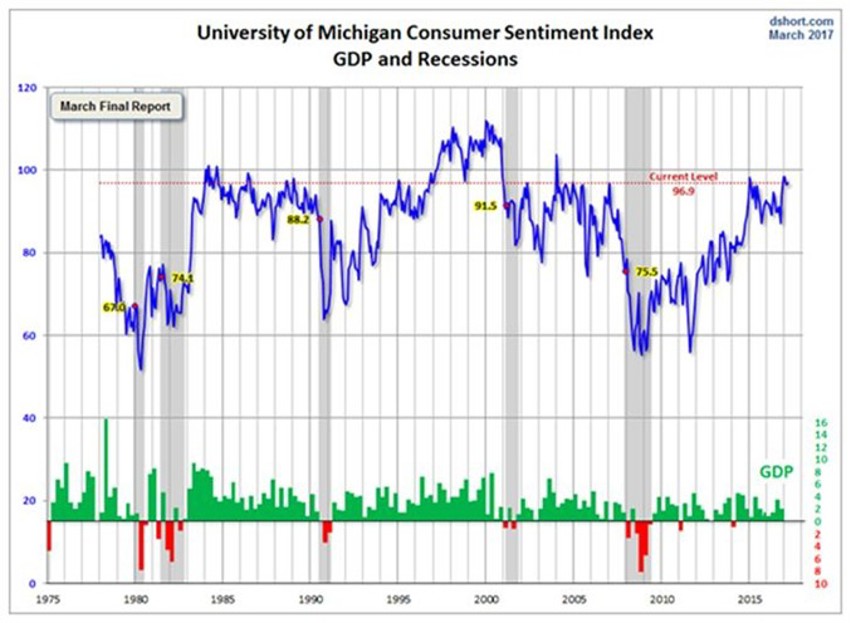
Now, the obvious message here is about consumer sentiment and that is what your eye trains on most of the time. It goes back to 1975.
Lots of stuff, right?
But here are the two things I would suggest we key in on:
a) The grey bands mark recessions - and we are nowhere close to the ingredients which come right before those bands have shown up in the past. These bands show up at the valleys, not the peaks.
b) Look at those little green and red bars at the bottom of the chart that show GDP growth or contraction. Count them if you must, but the key number is “19.”
There have been just 19 quarters of contraction in US GDP over the last 41.25 years.
There have been only 11 of these since 1990!
Too many investors spend all of their time trying to miss a small fraction of time based on historical factors.
Do you have any idea how much wasted movement, selling, buying, hedging and fearing the next shoe will drop has been implemented to somehow try and miss the impact of those 19 quarters over the last 41 years?
Too much!
Do less of this and your results will be set to improve over time.
Stop trying to prepare for the next problem and instead embrace the rewards of the trek up the mountain, a required journey in order to obtain your financial goals.
It is as much as a requirement for your future as is breathing.
This is why we express the need to focus on the Barbell Economy – a rare event set to be with us for the next 30 plus years!