The World Economy by the Numbers
How big is the world economy today?
With all the negative hand-wringing, non-stop media chatter and parochial perspectives, most folks overlook just how big everything has become during these so-called perilous times.
Let's have a look at the true picture of the global financial world, with a little help from our friend Scott Grannis of the Calafia Beach Pundit:
Now, the latest US Federal Reserve data shows that household net worth rose by $8.2 trillion (a gain of 9.3%) over the most recent 12-month period.
This came from a combination of a $6.6 trillion gain in financial assets and a $1.9 trillion rise in the value of real estate holdings.
Interestingly, the latter category is $2 trillion more valuable than at the peak of the housing bubble in 2000!
Some further good news inside the data?
With household debt rising by less than $500 billion in the past year, household leverage (total debt as a percent of total assets) has now fallen by one-third since the all-time high in 2009.
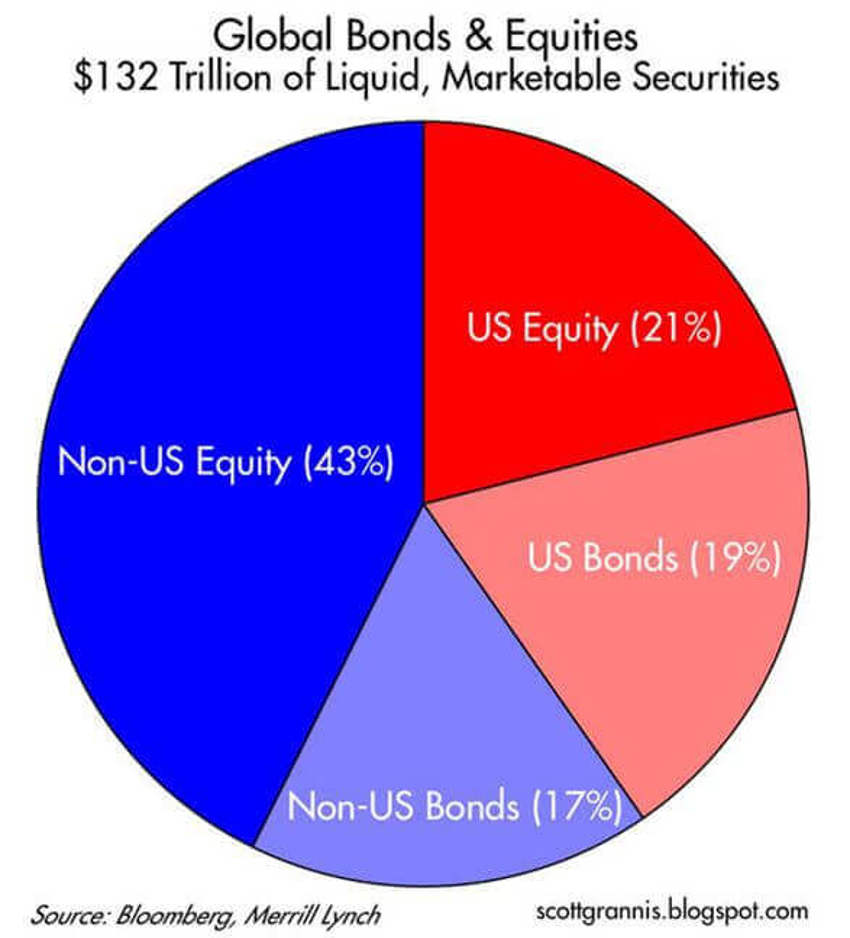
Global GDP is roughly $80 trillion (about four times the size of the US economy). And the chart above shows you that the world's economy supports actively traded bonds and stocks worth $132 trillion.
About 40% of that total is US-based.
Dr Ed Yardeni reminds us that there's really nothing unusual about this, as a typical US household has a net worth (stocks, bonds, savings accounts and real estate) equal to about roughly three times its annual income.
But the Fed is Raising!
Even though assets and earnings continue to expand at relatively normal long-term pace, the fear remains that the US Fed will kill it all with rate increases.
Is that true?
Well, here are the facts:
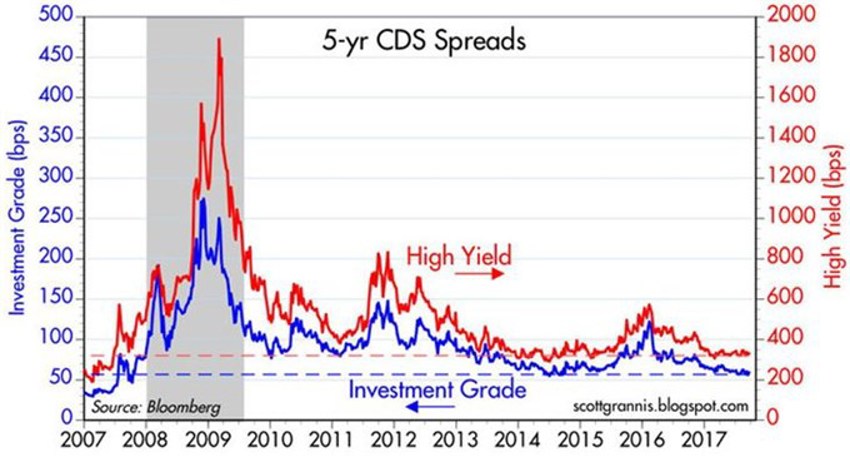
The chart above shows credit spreads in the US are at relatively low levels ("normal" swap spreads are 15-30 bps or so).
That suggests systemic risk is low, liquidity is plentiful, and the economy is unlikely to throw a wrench into the sales and profits of the US economy's businesses.
For the bond boys and policy wonks, this suggests that conditions are expected to be good and profits are expected to rise.
The data also suggests the Fed is years away from creating a liquidity squeeze, which could only be precipitated at this point by a massive reduction in bank reserves.
And there’s more to relive your concerns about rates:
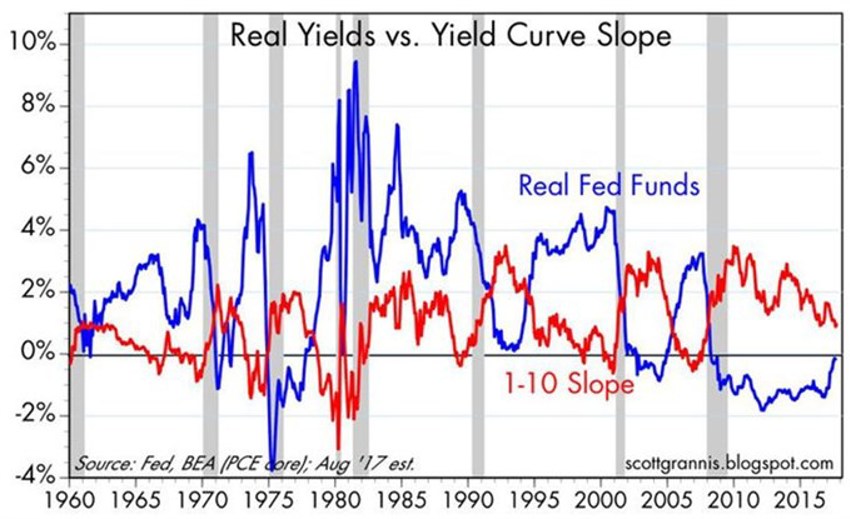
The chart above is important.
It shows that every recession in the past 60 years has been preceded by a substantial tightening of monetary policy.
How do we know?
Well, monetary policy is tight when the real Fed funds rate (blue line) is at least 3-4%, and when the Treasury yield curve (red line) is flat or inverted.
So, right now we are very, very likely years away from seeing those conditions happen again.
The proof is in the pudding…and the numbers.